
The impact of sewage on nature and wildlife and what we do about it are now casualties in an ideological and political war. Our rivers will suffer.
The release a few weeks ago by the Environment Agency of the total duration (in hours) of raw sewage spills in 2023 signalled the highest total ever recorded.
These were the headlines.
“Spills of raw sewage into England’s rivers and seas reached their worst on record last year.” Sky news.
“Water companies in England face outrage over record sewage discharges.” The Guardian.
“Raw sewage discharges in England and Wales hit record.” The Financial Times.
“Sewage spills in England double to record level.” The Times.
To be clear, before 2017 only 6% of licensed spill sites were monitored and virtually no one was paying any attention. So, we really have no idea. These headlines all imply it was the worst year ever for sewage discharges into rivers. They do that because it makes a better headline. And maybe because the authors think it’s true.
But to anyone who knows their history 2023 can’t have been a record year for the amount of raw sewage put into the water environment. We didn’t even treat sewage until the late 19th century. Bazelgette’s combined sewage system was commissioned after the Great Stink of 1858. The population might have been half what it is today, but in any town, city or village with a river or stream, it was ALL raw sewage before that. Latrines were built over rivers. Shit from buckets and night boxes was thrown into rivers. Streets, yards and gutters were washed into rivers. And as a result the poor, who tended to be housed on the low-lying “miasmic” land near rivers were all generally ill from what was called “low fever”, a form of chronic cholera. Thousands died from it and from dysentery every year.
The actual 2023 record, if there is one, relates to how extensive the monitoring now is, and also – if it could be measured – to how much people now care about what that monitoring tells us. Both of these are at an all time high and a very good thing too. Provided we respond with sensible policies that actually address the problem.
In attempting to contextualise the alarming figures, the EA was lambasted by some campaigners as playing “lacky” and being an “apologist” for the water industry (see Emma Gatten, Telegraph 27th March 2024). Helen Wakeham drew criticism for highlighting that although the figures set apparent records, 2023 was also the first year we had achieved 100% monitoring and the 6th wettest year since 1836.
That doesn’t make her an apologist. Helen Wakeham said that the figures were disappointing but not surprising. Both obviously true. The information is relevant because it puts the spills into perspective and perspective is important if you want to actually fix the problem. 3 million hours of raw sewage spills from 14000 overflows is awful. We all know that.
But I doubt it’s the worst we have ever experienced. The actual record years most likely went unrecorded and unnoticed. They were only ‘experienced’ as such, by wildlife.
I have some insight into this because I worked with Dr. Rose O’Neill and Kathy Hughes to flag the crisis in WWF’s 2017 report Flushed Away, when very few were paying any attention. Sewage in rivers wasn’t an issue in the public consciousness. But it was definitely an issue in rivers.
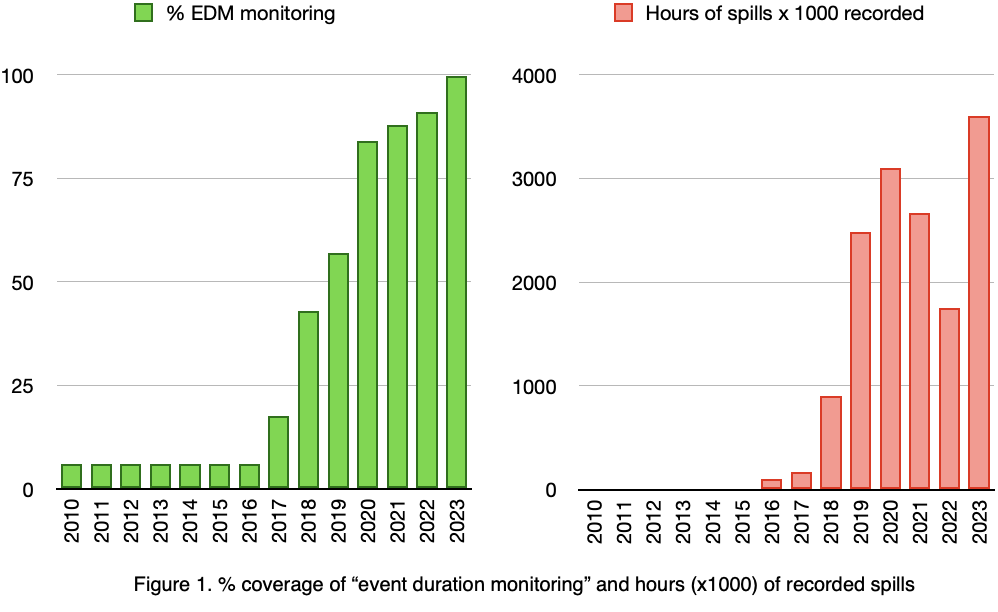
Figure 1. shows the coverage of storm overflow monitoring each year since 2016, when only 6% of storm overflows were monitored. The graph on the right shows the total hours of recorded spills since 2016. Before 2016 we know the data is scant and not generally representative. When Dr O’Neill put in an FOI request to water companies to help with the WWF report she got very little information back, not least because there was very little information. What we did get back suggested is was already a big problem.
The response to that report from Water UK pushed back against some of the findings – time has shown WWF had a strong case – but did reference the £billions the industry had invested since 1990, highlighting that sewage discharges (legal ones at least) had been of a generally lower standard through most of the 20th century. We know they were.
Out of context, the figures for 2023 don’t tell us a great deal, other than that we have a big problem with raw sewage discharging to rivers because the system is designed to spill when the works are overwhelmed by flow, which they are far too often. As WWF highlighted, under-capacity at the works was a problem in 2017 and had been an incipient problem for many years, because of a shortfall of investment under public and then privatised ownership.
It’s worth pausing on that word “shortfall”, because there has been investment. Far more under private ownership than state, in fact, albeit not enough under either. The shortfall has been created by two things: higher standards and higher loads. More stringent standards of water treatment, and higher expectations from the public (the latter, very recent); and increases in population, urbanisation, water consumption, the use of wet wipes and since 2020 different working patterns. To cope with all this, clearly we should have been investing more and at a faster pace. Now, we have been caught with our proverbial pants down. Just like WWF said we would be.
So, we know there was a problem and we know we weren’t measuring it. In contextualising and understanding 2023 figures therefore, surely the % coverage of monitoring (it’s the first year we’ve known the full picture) and the rainfall (the amount of rain is a major contributory factor) are at least relevant? To think so doesn’t suggest that the spills are okay. But it might help us get a more accurate picture of where we are historically – or rather a less inaccurate picture – and some inkling into whether recent investment is making any impact.
It might also help us define the true scale of the issue and think about the nuances within it and therefore set about the best strategy for actually fixing things. It’s all very well banging on about the hole in the roof. We need a plan for how to repair it correlated to articulated aims and available funds. “Woe betide the iniquities” is not a plan. “Just enforce the law” is not a plan.
The public deserves to understand that these works will carry on spilling for years to come, because you can’t just shut the system down. From the left, or right, state-owned or private, we need to fix the system strategically according to agreed priorities. I’m sure most people – once they understood the complexities and the unavoidable need to choose what comes first, second, third etc. would agree that our strategy should prioritise according to the relative severity of harm caused to the natural environment. So, why aren’t we discussing how to do this? Because, in the media and social media at least, the issue has been hi-jacked by political ideology. Some actors want 2023 to have been the worst year on record, because it suits their political allegiance and narrative. In the same way, they recite that “no river in England or Wales is at good overall status”, even though this statistic is only true if you loop in the assessment of esoteric chemicals we could not even detect until a few years ago.
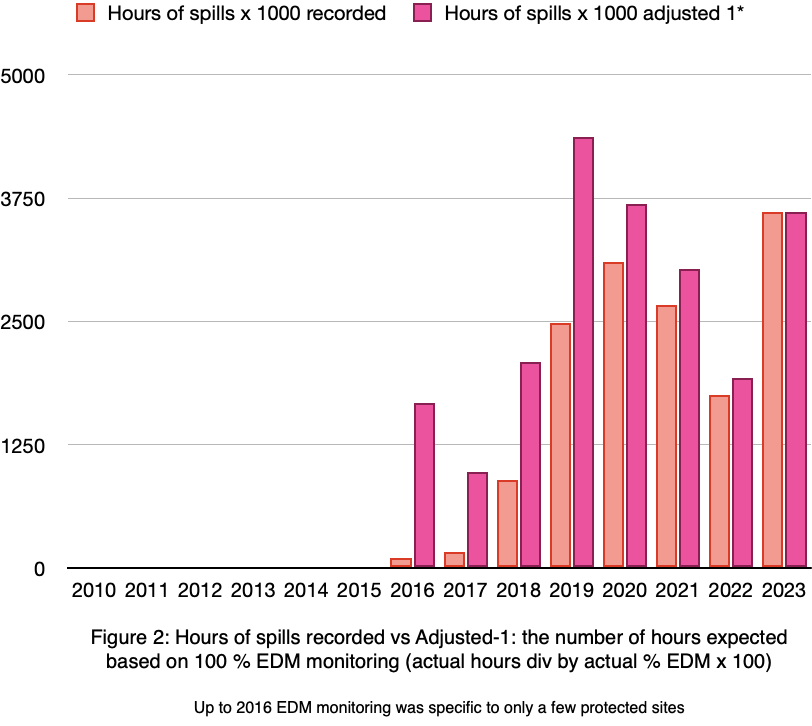
In Figure 2. I have compared actual recorded hours (which until 2023 obvs only recorded a % of the overflow sites) with an estimated total hours of spill duration in earlier years, which I have calculated by taking the total recorded hours in the given year, dividing by the % coverage of monitoring, and multiplying by 100. It’s a crude guesstimation, but this might, at least, give a more comparable set of numbers.
This graph suggests that had we been able to record all the storm overflows, 2019 is more likely to have been a worse year – a lot worse – than 2023. 2020 was perhaps worse too. Given that the monitoring up to 2016 was generally confined to protected sites and therefore not widely representative, the adjusted figures for 2016 and maybe even 2017 / 2018 could be considerable underestimations of what was going on. The Flushed Away report suggested as much.

So, what about the rain? 2023 was a very wet year (God knows what 2024 figures will show). The 6th wettest in England since 1836. Not an excuse or apology, just a fact. Interestingly and worryingly, it’s only the 3rd wettest since 2000. Changes in the climate are not making us drier, as the long-term trendline in the chart above shows.
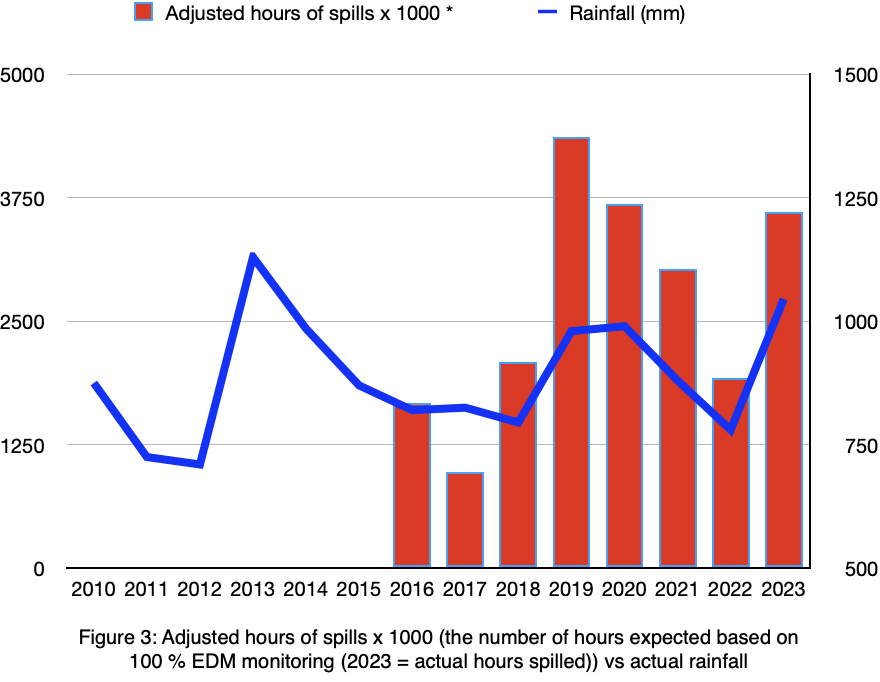
In figure 3. I have plotted the average England rainfall since 2010 against those adjusted figures for spills. There is clearly a strong correlation between rainfall and spilling hours. Of course there is. The driest year in that period, 2022, is also the year with the lowest adjusted figure for spills. In fact a 1% difference in rainfall seems to have a big gearing impact on spills. A difference of 34% in rainfall between 2022 and 2023, correlated to an increase of 54% in spills.
In these figures there are some interesting indications.
2019 was not the wettest year by a long way. And yet it seems to have the worst adjusted figure for spills, also by a long way. 2020 should have been worse, but wasn’t.
2019 through to 2022 shows a marked year on year decline in the estimated spills, which might suggest improvements. On the other hand the possible apparent “improvements” might also be explained simply by the lower rainfall through those same years.
But going on the preceding estimated figures, the final year 2023 – the year that has caused these “record spills” headlines – saw considerably fewer spills relative to rain than 2019 (albeit these figures do have to be viewed with caution).
So, it may even be that spilling relative to rain is marginally better now than in 2019 at the start of the “conscious” sewage crisis. But it also looks as if normal parameters of rainfall change make a big difference. We all know that shouldn’t be the case. Our creaking infrastructure is undoubtedly overstretched, even at the best of times.
In short, I suspect that 2023 wasn’t the worst year ever. 2019 might well have been worse. But if we could only go back in time and monitor the situation I suspect that 2012, being wetter still, might well have been even worse than that.
And then what about the 1970s. I can vividly remember the stink of the Tyne in about 1976 when I went there to visit my godparents and we stood on the high bridge over the river and wondered if any fish could live in it at all.
And what about the 1870s and the decades before?

Michael Faraday wrote to The Times in 1855 describing the River Thames: “Near the bridges the feculence rolled up in clouds … The smell was very bad, and common to the whole of the water; it was the same as that which now comes up from the gully-holes in the streets; the whole river was for the time a real sewer”.
You could call it a “real sewer” today, from time to time: I’ve been in a boat on the river when a sewer was spilling near the mouth of the Colne and it was horrendous. But I’m still alive. In 1831 cholera killed 6,536 people in London. In 1847 it killed 14,137 people. And in 1855 it killed 10,738 people.
People were metaphorically and perhaps even literally drowning in sewage. The sewage system that so frustrates us is also, in fact, a miracle. Half the increase in the longevity of people in Britain that accrued between 1850 and 1950 is directly attributable to improvements in sewage disposal and treatment.
As Hans Rosling wrote in his excellent book Factfulness, there is such a thing as “bad, better”.
That is where we are. It’s still bad. Really bad. But it is also … better. Much better. Better than it has been since probably before the 19th century.
The reason why it is important to acknowledge the complex truth – one that doesn’t fit the inclination of the media to dramatise and simplify – is because, as Rosling says, “when people wrongly believe that nothing is improving, they may conclude that nothing we have tried so far is working and lose confidence in measures that actually do work.”
Alarmist headlines that don’t tell the whole truth may lead to the evolution of radical measures that won’t work at all. Or ones that might feel good, but still won’t address the problem. Or, worst of all, to damaging unintended consequences.
Nuance is dull. It doesn’t sell papers. It doesn’t make you a folk-hero. But nuance does matter when you have limited resources, when there are many other pressures on our environment which also need to be addressed, and when we want the best overall outcome for nature.
How many people would now believe that water quality in rivers is generally getting better? Not universally, but in terms of foul sewage, this is actually the case. Is water quality in British rivers “better than at any time since the end of the Industrial Revolution”? (MJ Whelan et al) describes a mixed picture of recovery in water quality since the industrial revolution and also compared to a three-decade period 1980 to 2020. Their conclusions – summarised in the diagram below taken from their paper – broadly suggest that faecal indicator organisms downstream of urban centres are much lower now than at any time since before the industrial revolution, while pollutants from diffuse and rural pollution are likely to be higher. They also point to a reduction in industrial pollution and a rise in novel pollutants.
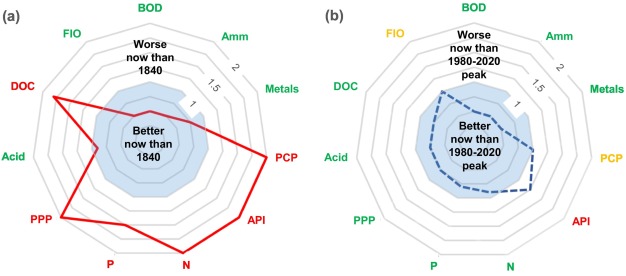
(BOD – biological oxygen demand / Amm = ammonia / Metals / PCP = pentachlorophenol / API = active pharmaceutical ingredients / N = nitrogen / P = phosphorus / PPP = plant protection products / Acid / DOC = dissolved organic carbon / FIO = faecal indicator organisms)
Ecologically, things aren’t obviously getting worse, either. Water quality – as reflected in invertebrate data – is arguably better now than it was 30 years ago, albeit improvements appear to have stalled in about 2010. The paper referenced above shows that across six invertebrate taxa with an aquatic life stage a nadir occurred in about the mid 1980s (something I have long thought just going on my own observations as a conservationist / angler: our English rivers, certainly our chalk streams, were absolutely screwed in the mid 1980s and have been steadily improving since then)
The authors of this paper: The recovery of European freshwater diversity has come a halt speculate – and I’m sure they’re right – that an increase in richness and abundance reflected improvements in water treatment in the 1990s and early 2000s. The improvements have plateaued for a number of possible reasons. Pollution from road and farm run-off may now be the greater limiting factor in many places, especially in less absorbent catchments with higher drainage densities and more surface flow pathways than chalk streams. Physical habitat may also be a limiting factor: the authors observed that physical modifications and urbanisation seemed to inhibit recovery.
But I would also hazard that improvements have plateaued because most of the upgrades in our sewage systems have been driven by urban wastewater treatment rules focussed on larger sewage works serving populations of at least 2000 or greater, while smaller descriptive works have been left behind and are still discharging – perfectly legally – sewage that is very rich in the nutrients that drive eutrophication.
These larger works that have benefitted from investment tend to be in the lower reaches of catchments where populations are higher. Meanwhile, headwater streams and the upper reaches of rivers in the countryside, places offering the greatest potential for biodiversity improvements, have received comparatively little investment.
In short, our water quality policies are already skewed by economic assessment algorithms which send investment to places where population centres are biggest, not where wildlife is most fragile, or where there is the greatest potential for gains in biodiversity and abundance. Cost-benefit calculations are based on cost per head of population instead of cost per linear length of improved watercourse, or cost relative to the ecological impact.
Now, the outrage people feel about the sewage crisis – and the way in which some organisations and individuals are focussing solely on this at the expense of paying any heed at all to other pressures – threatens to catalyse policies that double down on this utterly anthropocentric approach.
The CaBA chalk stream group has been arguing since 2021 that these cost-benefit algorithms are wrong and that we urgently need to upgrade the hundreds and thousands of small, rural sewage works that dribble nutrient rich, but legally discharged sewage, into small streams, tributaries and headwaters all day long, every day of the year.
But sadly ALL the noise is about raw sewage discharges mixed with ideological and political campaigning.
The difference in ecological impact is almost incomparable between the unsung discharges of these works into countless small streams in August and groundwater discharges into swollen rivers in February. The outraged public are being poorly served all round, not just by water companies and government.
Unless we start to articulate the complexities and interconnectedness of the pressures on our rivers we will get ham-fisted and ineffective policy responses. Steve Reid, for example, who has a great opportunity to articulate some really good policy commitments has said only that Labour will make “law-breaking water bosses personally criminally liable if they refuse to stop illegal sewage dumping”. A vote-winner of a statement no doubt, but these water company bosses don’t wake up of a morning and pull a lever marked “illegal dumping” whilst stroking a white cat. The system dumps. For sure, the system is overloaded and has been terribly neglected. And water company bosses, along with Ofwat, regulators, government and private equity all share some responsibility for that. But you can’t stop the dumping today, without stopping the system, which would involve everyone in the country popping a cork up their backsides or waddling back to the garden privy and long-drop.
What do we actually want? To send water company bosses to jail? Or cleaner rivers for wildlife and people?
If we want the latter, then sewage treatment or lack of it, needs to be put in context, assessed soberly alongside all the other pressures and subsumed into an overall plan to improve rivers.
